Download the accompanying IPython Notebook for this Tutorial from Github.
Python streamlines tasks requiring multiple steps in a single block of code. For this reason, it is a great tool for querying and performing analysis on data.
‘The only thing constant is change’
The Rate of Change (ROC) is calculated as follows:
ROC = ((Most recent closing price - Closing price n periods ago) / Closing price n periods ago) x 100The Rate of Change (ROC) is classed as a momentum indicator because it measures strength of price momentum. For example, if a stock’s price at the close of trading today is 10, and the closing price five trading days prior was 7, then the Rate of Change (ROC) over that time frame is approximately 43, calculated as (10 – 7 / 7) x 100 = 42.85.
The Rate of Change (ROC) is also sometimes used to indicate overbought or oversold conditions for a security. Positive values that are greater than 30 are generally interpreted as indicating overbought conditions, while negative values lower than negative 30 indicate oversold conditions.
1.) Import modules.
import pandas as pd
import numpy as np
from pandas_datareader import data as web
import matplotlib.pyplot as plt
%matplotlib inline
2.) Define function for querying daily close.
def get_stock(stock,start,end):
     return web.DataReader(stock,'google',start,end)['Close']
3.) Define function for Rate of Change (ROC).
def ROC(df, n):
    M = df.diff(n - 1)
    N = df.shift(n - 1)
    ROC = pd.Series(((M / N) * 100), name = 'ROC_' + str(n))
    return ROC
How does the ROC function work?
#M = df.diff(n - 1)
3.b.) Function calculates closing price n periods ago. Sets the value to variable N.
#N = df.shift(n - 1)
3.c.) Function creates series called ROC that is ((M/N) * 100)
#ROC = pd.Series(((M / N) * 100), name = 'ROC_' + str(n))
3.d.) Function returns ROC
#return ROC
4.) Query daily close for ‘FB’ during 2016.
df = pd.DataFrame(get_stock('FB', '1/1/2016', '12/31/2016'))
5.) Run daily close through ROC function. Save series to new column in dataframe.
df['ROC'] = ROC(df['Close'], 12)
df.tail()
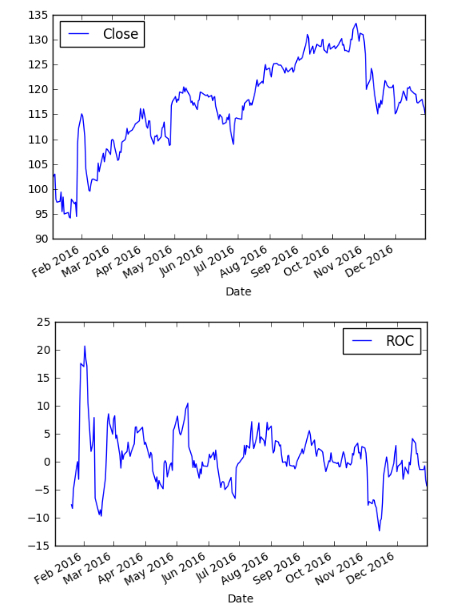
6.) Plot daily close and ROC.
df.plot(y=['Close'])
df.plot(y=['ROC'])

There you have it! We created our ROC indicator. Here’s the full code:
import pandas as pd
import numpy as np
from pandas_datareader import data as web
import matplotlib.pyplot as plt
%matplotlib inline

def get_stock(stock,start,end):
     return web.DataReader(stock,'google',start,end)['Close']

def ROC(df, n):
    M = df.diff(n - 1)
    N = df.shift(n - 1)
    ROC = pd.Series(((M / N) * 100), name = 'ROC_' + str(n))
    return ROC

df = pd.DataFrame(get_stock('FB', '1/1/2016', '12/31/2016'))
df['ROC'] = ROC(df['Close'], 12)
df.tail()